
Introduction
In today’s digital world, data has become one of the most valuable resources for businesses, researchers, and technology companies. Organizations collect massive amounts of data every day from websites, mobile apps, financial systems, customer interactions, and sensors. However, raw data alone has little value unless it can be analyzed and transformed into meaningful insights. This is where data analysis becomes essential.
Data analysis is the process of inspecting, cleaning, transforming, and interpreting data to discover useful information and support decision-making. Companies use data analysis to understand customer behavior, predict future trends, optimize marketing strategies, and improve products. In the field of artificial intelligence and machine learning, data analysis is even more critical because machine learning models depend heavily on high-quality datasets.
Python has become the most popular programming language for data analysis and data science. Its simplicity, powerful libraries, and strong community support make it an ideal choice for beginners as well as professional data scientists. One of the most important libraries in the Python ecosystem is Pandas.
Pandas for Data Analysis in Python has become the industry standard tool for working with structured data. The library provides powerful tools for loading datasets, cleaning messy data, filtering information, performing statistical analysis, and preparing data for machine learning models. Whether you are analyzing business sales data, financial records, research datasets, or AI training data, Pandas plays a central role in the workflow.
Pandas is part of the broader Python data ecosystem, which includes libraries such as NumPy, Matplotlib, and Scikit-learn. NumPy provides efficient numerical operations, Matplotlib helps visualize data through charts and graphs, and Scikit-learn is widely used for building machine learning models. Together, these libraries form the foundation of modern data science workflows.
In this beginner guide, you will learn how Pandas for Data Analysis in Python works and why it is one of the most important tools for data scientists and developers. By the end of this tutorial, you will understand how to install Pandas, work with DataFrames and Series, load datasets, explore data, clean messy datasets, and perform real-world data analysis using Python.
If you’re new to programming, it’s helpful to first learn Python for beginners before diving into data analysis libraries like Pandas.
What is Pandas in Python?
Pandas is an open-source Python library designed specifically for data manipulation and data analysis. It provides powerful tools that allow developers and data scientists to work with structured datasets efficiently. The name “Pandas” comes from the term Panel Data, which refers to multi-dimensional structured data commonly used in statistics and economics.
The library was created by Wes McKinney in 2008 while he was working on financial data analysis tools. At the time, there was a need for a flexible and efficient library that could handle large datasets and perform complex data transformations. Pandas was developed to solve these problems, and over time it became one of the most widely used libraries in the data science community.
Pandas is built on top of the NumPy library, which provides fast numerical operations and efficient array structures. By using NumPy internally, Pandas can process large datasets quickly while providing a more user-friendly interface for working with tabular data.
The main purpose of Pandas is to make data analysis tasks easier. With just a few lines of Python code, users can load datasets, filter rows, calculate statistics, clean missing values, and perform complex data transformations.
Some of the key capabilities of Pandas include:
- Reading data from multiple file formats such as CSV, Excel, JSON, and SQL databases
- Cleaning and preprocessing messy datasets
- Filtering and selecting specific rows or columns
- Handling missing or incomplete data
- Aggregating and grouping data for analysis
- Performing statistical calculations on datasets
Because of these powerful features, Pandas for Data Analysis in Python is widely used in many industries including finance, healthcare, marketing, research, and artificial intelligence development.
Pandas is built on top of NumPy for AI beginners, which provides powerful numerical operations for handling arrays and mathematical computations.
For more detailed explanations and advanced features, you can explore the Pandas official documentation provided by the developers.
Why Pandas is Important for Data Analysis
Pandas has become the standard tool for data analysis in Python because it simplifies many complex data processing tasks. Before Pandas existed, analysts often had to write long and complicated code to manipulate datasets. Pandas provides a cleaner and more intuitive way to perform these operations.
One of the main reasons Pandas is so popular is its ability to work with structured data efficiently. Most real-world datasets are stored in formats such as spreadsheets, CSV files, or database tables. Pandas allows users to load and manipulate this type of data using simple commands.
Another advantage of Pandas is its flexibility. The library can handle small datasets for simple analysis as well as large datasets used in data science and machine learning projects. Because Pandas integrates well with other Python libraries, it fits naturally into larger data processing workflows.
Pandas is built on top of the powerful NumPy library, which provides efficient numerical operations and array structures.
Some key advantages of using Pandas include:
Easy Data Manipulation
Pandas provides simple functions for filtering, sorting, and modifying data. Tasks that would normally require dozens of lines of code can often be completed with a single command.
Powerful Data Cleaning Tools
Real-world datasets are rarely perfect. They often contain missing values, duplicates, or inconsistent formats. Pandas includes built-in tools for detecting and fixing these issues.
Support for Multiple Data Formats
Pandas can read and write many different file formats including:
- CSV files
- Excel spreadsheets
- JSON files
- SQL databases
This flexibility makes it easy to integrate Pandas into different data pipelines.
Integration with Data Science Libraries
Pandas works seamlessly with popular Python libraries such as:
- NumPy for numerical computing
- Matplotlib for data visualization
- Scikit-learn for machine learning
Because of this integration, Pandas is often used as the first step in machine learning workflows, where datasets must be cleaned and prepared before training models.
Today, professionals in industries such as finance, marketing, healthcare, and artificial intelligence rely heavily on Pandas for analyzing datasets and generating insights that support better decision-making.
Installing Pandas in Python
Before you can start using Pandas for Data Analysis in Python, you need to install the library in your Python environment. Fortunately, installing Pandas is simple and only requires one command.
Before installing Pandas, make sure you have the Python programming language installed on your system.
The most common way to install Pandas is by using the pip package manager, which comes with Python.
Install Pandas Using pip
Open your terminal or command prompt and run the following command:
pip install pandas
This command downloads the latest version of Pandas and installs it automatically along with its required dependencies.
Install Pandas Using Anaconda
If you are using the Anaconda distribution, which is popular among data scientists, you can install Pandas using the conda package manager:
conda install pandas
Anaconda environments already include many data science libraries, so in many cases Pandas may already be installed.
Verify the Installation
After installing Pandas, you can verify that it works correctly by running the following Python code:
import pandas as pdprint(pd.__version__)
If Pandas is installed successfully, this command will print the installed version of the library.
Once Pandas is installed, you can begin using it to load datasets, analyze data, and build powerful data analysis workflows in Python.
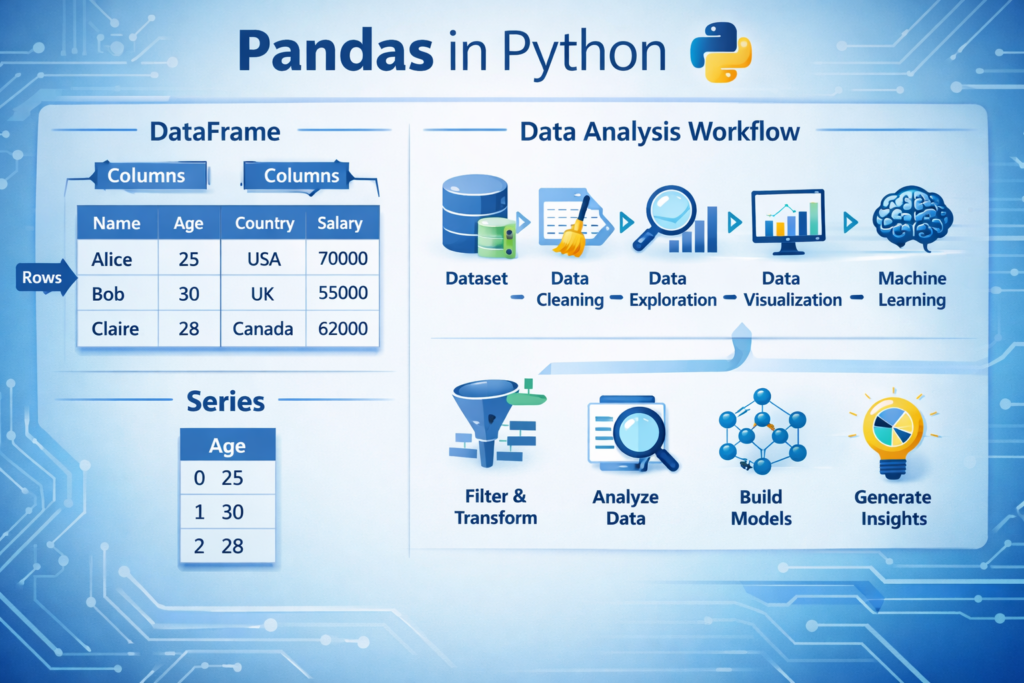
Understanding Pandas Data Structures
One of the most important concepts to understand when learning Pandas for Data Analysis in Python is the data structures used by the library. Pandas provides two primary data structures that allow developers to organize and manipulate data efficiently: Series and DataFrame.
These structures are designed to make working with tabular data easier, similar to how spreadsheets organize information into rows and columns. By understanding these two structures, you can perform most data analysis tasks in Python.
Pandas Series
A Pandas Series is a one-dimensional data structure that stores a sequence of values. You can think of a Series as a single column in a spreadsheet or a labeled list of data.
Each value in a Series is associated with an index, which acts like a label for the data. This indexing system allows you to access specific elements easily.
Here is a simple example of creating a Pandas Series:
import pandas as pddata = pd.Series([10, 20, 30, 40])print(data)
Output example:
0    10
1    20
2    30
3    40
dtype: int64
In this example:
- The numbers on the left (0,1,2,3) represent the index
- The numbers on the right are the actual data values
You can also assign custom labels to the index:
data = pd.Series([10, 20, 30], index=["A", "B", "C"])
This feature makes Series useful when working with labeled datasets.
Although Series are useful, most real-world data analysis tasks use the DataFrame structure, which is more powerful.
Pandas DataFrame
A DataFrame is the most important data structure in Pandas. It represents a two-dimensional table with rows and columns, similar to an Excel spreadsheet or a database table.
Each column in a DataFrame can store a different type of data, such as numbers, text, or dates.
Here is an example of creating a DataFrame:
import pandas as pddata = {
    "Name": ["Ali", "Sara", "Ahmed"],
    "Age": [25, 30, 28],
    "City": ["Karachi", "Lahore", "Islamabad"]
}df = pd.DataFrame(data)print(df)
Output:
     Name  Age       City
0     Ali   25    Karachi
1    Sara   30     Lahore
2   Ahmed   28  Islamabad
In this table:
- Each row represents a record
- Each column represents a variable or attribute
DataFrames are extremely powerful because they allow you to:
- Filter rows
- Select specific columns
- Perform calculations
- Group and summarize data
Because of these capabilities, DataFrames are the foundation of Pandas for Data Analysis in Python.
Loading Data with Pandas
In real-world data analysis projects, datasets are usually stored in external files rather than created manually in code. Pandas provides powerful functions for loading data from different file formats.
The most common dataset formats include CSV files, Excel spreadsheets, and databases.
Reading CSV Files
CSV (Comma-Separated Values) files are one of the most common formats used for storing datasets. Many open datasets and machine learning datasets are distributed in CSV format.
Pandas makes it easy to load CSV files using the read_csv() function.
Example:
import pandas as pddf = pd.read_csv("data.csv")print(df.head())Explanation:
read_csv()loads the datasetdf.head()displays the first few rows
This allows you to quickly inspect the structure of the dataset.
Reading Excel Files
Many businesses store their data in Excel spreadsheets. Pandas can also read Excel files using the read_excel() function.
Example:
df = pd.read_excel("data.xlsx")This command loads the Excel file into a DataFrame so you can analyze it using Pandas.
By supporting multiple file formats, Pandas allows analysts to work with data from many different sources.
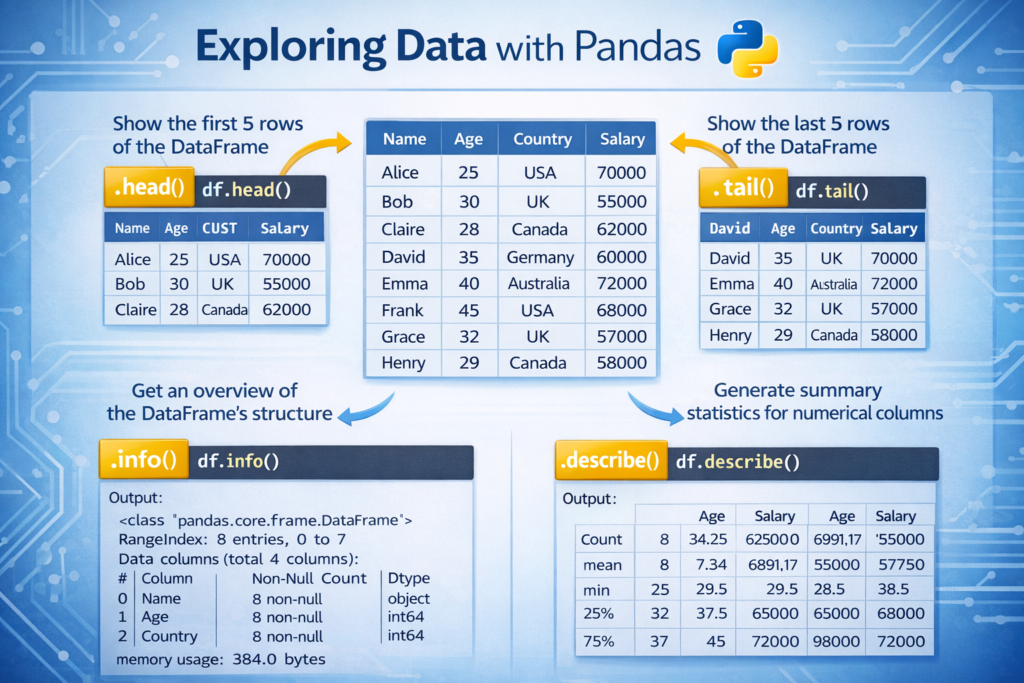
Exploring Data in Pandas
After loading a dataset, the next step in data analysis is exploring the data. This process helps you understand the structure of the dataset, identify potential problems, and gain initial insights.
Pandas provides several useful functions for quickly inspecting datasets.
Viewing the First Rows of Data
To see the first few rows of a dataset, you can use the head() function.
Example:
df.head()
By default, this function shows the first five rows of the dataset. This is useful for quickly understanding what the data looks like.
Viewing the Last Rows
You can also view the last rows of the dataset using:
df.tail()
This helps you check how the dataset ends.
Viewing Dataset Information
To get information about the dataset structure, you can use the info() function.
Example:
df.info()
This command displays:
- Column names
- Data types
- Number of non-null values
- Memory usage
Understanding the data types of columns is important when performing data analysis.
Statistical Summary of Data
Pandas can also generate statistical summaries using the describe() function.
Example:
df.describe()
This function calculates statistics such as:
- Mean
- Standard deviation
- Minimum value
- Maximum value
- Quartiles
These statistics help analysts understand the distribution of numerical data.
Selecting and Filtering Data
In most data analysis tasks, you do not work with the entire dataset at once. Instead, you select specific columns or filter rows based on conditions.
Pandas makes this process simple and efficient.
Selecting a Single Column
You can select a column using its name.
Example:
df["Age"]
This returns all values from the Age column.
Selecting Multiple Columns
To select multiple columns, use double brackets:
df[["Name", "City"]]
This returns a new DataFrame containing only the selected columns.
Filtering Data Based on Conditions
You can filter rows based on specific conditions.
Example:
df[df["Age"] > 25]
This command returns only the rows where the Age value is greater than 25.
Filtering data is extremely useful in real-world analysis tasks such as:
- Finding high-value customers
- Identifying sales above a certain threshold
- Detecting unusual data patterns
Cleaning Data with Pandas
One of the most important steps in data analysis is data cleaning. Real-world datasets are often messy and may contain missing values, duplicates, or inconsistent data.
Pandas provides several tools to help clean and prepare datasets.
Handling Missing Values
Missing values are very common in datasets. Pandas allows you to detect missing values easily.
Example:
df.isnull().sum()
This command shows the number of missing values in each column.
Removing Missing Values
You can remove rows containing missing data using:
df.dropna()
Filling Missing Values
Sometimes it is better to replace missing values rather than remove them.
Example:
df.fillna(0)
This replaces missing values with 0.
Removing Duplicate Data
Datasets may also contain duplicate records, which can distort analysis results.
Pandas allows you to remove duplicates using:
df.drop_duplicates()
Cleaning duplicates ensures that each record in the dataset represents unique information.
Data cleaning is often the most time-consuming part of data analysis, but it is essential for producing accurate insights.
Data cleaning is also important in natural language processing. For example, text preprocessing in Python involves removing noise from text datasets before training AI models.
Real-World Data Analysis Example with Pandas
Understanding theory is important, but the real power of Pandas for Data Analysis in Python becomes clear when we apply it to real datasets. Businesses, researchers, and data scientists frequently analyze datasets to discover patterns and make decisions.
Let’s look at a simple example of analyzing a sales dataset using Pandas.
Imagine a small dataset that contains product sales data.
| Product | Sales |
|---|---|
| Laptop | 500 |
| Phone | 300 |
| Tablet | 200 |
| Laptop | 450 |
| Phone | 350 |
We can load this dataset into a Pandas DataFrame and analyze it.
import pandas as pddata = {
    "Product": ["Laptop", "Phone", "Tablet", "Laptop", "Phone"],
    "Sales": [500, 300, 200, 450, 350]
}df = pd.DataFrame(data)print(df)
Output:
   Product  Sales
0   Laptop   500
1    Phone   300
2   Tablet   200
3   Laptop   450
4    Phone   350
Now we can analyze the dataset.
Calculate Total Sales
total_sales = df["Sales"].sum()
print(total_sales)
This calculates the total revenue generated by all products.
Group Data by Product
Businesses often want to know which product generates the most revenue.
df.groupby("Product")["Sales"].sum()Example output:
Laptop    950
Phone     650
Tablet    200
From this analysis, we can see that Laptop sales generated the highest revenue.
This simple example demonstrates how Pandas can quickly transform raw data into meaningful insights.
In real-world scenarios, analysts often work with datasets containing thousands or millions of rows, but the same Pandas techniques still apply.
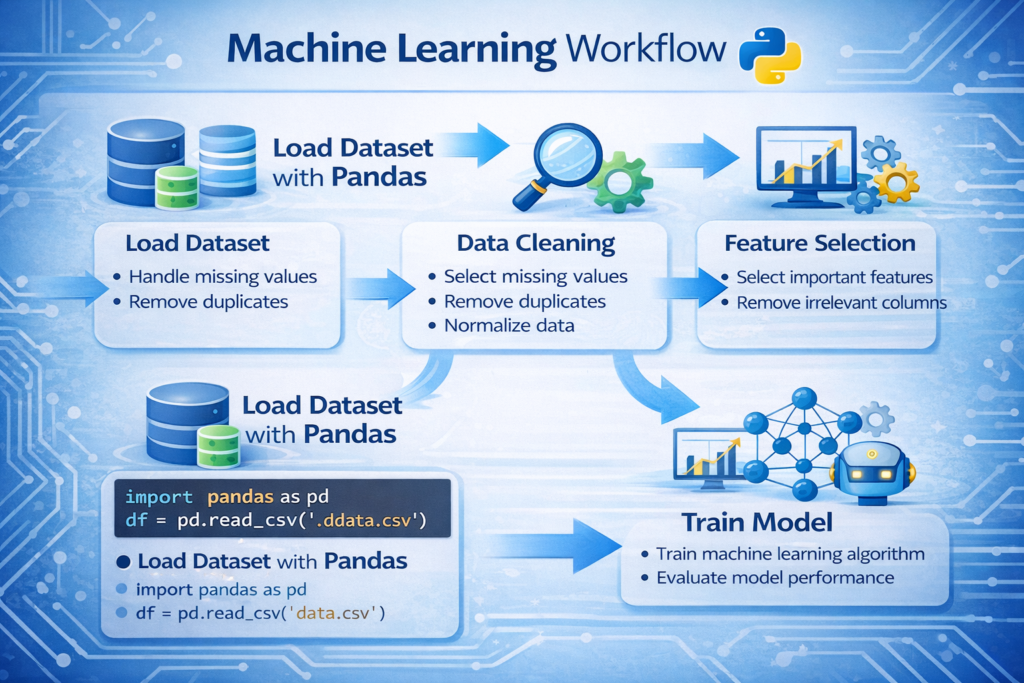
Pandas in Machine Learning and AI Workflows
In modern artificial intelligence systems, data preparation is one of the most important steps. Machine learning algorithms rely heavily on well-structured datasets. Before training a model, the data must be cleaned, transformed, and organized properly.
This is where Pandas for Data Analysis in Python becomes essential.
Most machine learning workflows follow these steps:
- Load the dataset
- Clean and preprocess the data
- Select important features
- Prepare training and testing datasets
- Train machine learning models
Pandas plays a major role in the first four steps.
After preparing datasets with Pandas, they can be used to train models using the Scikit-learn machine learning library.
Example: Preparing a Dataset for Machine Learning
Imagine a dataset that contains information about customers and whether they purchased a product.
import pandas as pddata = pd.read_csv("customers.csv")X = data.drop("Purchased", axis=1)
y = data["Purchased"]
Explanation:
- X contains the input features used to train the model
- y contains the target variable (the prediction label)
After this step, the dataset can be used with machine learning libraries such as:
- Scikit-learn
- TensorFlow
- PyTorch
In many data science projects, Pandas is the first tool used before building AI models. Without proper data preparation, machine learning models cannot produce accurate predictions.
Before training machine learning models, datasets are usually prepared using Pandas. You can learn more in our guide on Python for AI complete beginner guide.
When NOT to Use Pandas
Although Pandas is extremely powerful, it is not always the best solution for every data analysis task. Understanding its limitations helps developers choose the right tools for large-scale data processing.
Memory Limitations
Pandas loads data directly into memory (RAM). If a dataset is extremely large, such as several gigabytes or terabytes, it may exceed the available memory on your computer.
In such cases, alternative tools may be more suitable.
Examples include:
- Dask
- Apache Spark
These frameworks are designed for processing large datasets that do not fit into memory.
Single-Threaded Processing
Most Pandas operations run on a single CPU core. While this works well for small and medium datasets, it may not be efficient for extremely large datasets that require parallel processing.
Distributed computing tools such as Spark can perform operations across multiple machines.
Big Data Workloads
For massive enterprise datasets used in large data pipelines, specialized big data technologies are often required. However, for most everyday data analysis tasks, Pandas remains an excellent and practical tool.
Understanding these limitations helps analysts decide when to use Pandas and when to switch to more scalable technologies.
Best Practices for Using Pandas Efficiently
Using Pandas effectively requires following certain best practices that help improve performance and avoid common mistakes.
Always Inspect the Dataset First
Before performing any analysis, it is important to understand the dataset structure.
You can inspect the dataset using:
df.head()
df.info()
These commands allow you to quickly understand the column names, data types, and potential missing values.
Avoid Loops When Possible
One of the biggest mistakes beginners make is using Python loops to process data row by row.
Example of inefficient code:
for value in df["Sales"]:
    print(value)
Pandas works best with vectorized operations, which are faster and more efficient.
Example:
df["Sales"].mean()
Vectorized operations allow Pandas to process large datasets efficiently.
Handle Missing Data Early
Missing values can cause errors or misleading analysis results. It is best to detect and handle missing data early in the analysis process.
Example:
df.isnull().sum()
Once missing values are identified, they can be removed or replaced.
Use Clear and Consistent Column Names
Datasets with inconsistent column names can create confusion during analysis.
For example, instead of using column names like:
sales_data_2024_final
Use clear names such as:
Sales
Revenue
Customer_ID
Clean column names make the dataset easier to understand and maintain.
Common Pandas Functions Every Beginner Should Know
Pandas includes many useful functions that simplify data analysis tasks. Some of the most important functions include:
| Function | Purpose |
|---|---|
| head() | View the first rows of the dataset |
| tail() | View the last rows |
| info() | Display dataset structure |
| describe() | Show statistical summary |
| dropna() | Remove missing values |
| fillna() | Replace missing values |
| groupby() | Aggregate data by categories |
| sort_values() | Sort dataset values |
Learning these core functions can significantly improve your ability to analyze datasets quickly.
Conclusion
In modern data-driven industries, the ability to analyze data effectively is an essential skill. Python has become the leading programming language for data analysis, and Pandas is one of its most powerful libraries.
In this guide, we explored how Pandas for Data Analysis in Python helps developers and analysts manipulate structured datasets efficiently. We learned how to install Pandas, understand its core data structures, load datasets, explore data, filter information, and clean messy datasets.
We also looked at how Pandas is used in machine learning workflows and discussed situations where alternative tools may be required for extremely large datasets.
For beginners entering the world of data science, mastering Pandas is an important step toward understanding more advanced tools such as machine learning frameworks and AI systems.
By practicing the techniques covered in this guide and working with real datasets, you can quickly develop strong data analysis skills using Python.
Once you understand data analysis with Pandas, you can start building practical Python AI projects for beginners using real datasets.
FAQ
What is Pandas used for in Python?
Pandas is used for data manipulation, data cleaning, and data analysis in Python. It allows developers to work with structured datasets efficiently.
Is Pandas necessary for data science?
Yes. Pandas is one of the most widely used libraries in data science and is commonly used to prepare datasets for machine learning models.
Can Pandas handle large datasets?
Pandas can handle moderately large datasets, but extremely large datasets may require tools such as Dask or Apache Spark.
Is Pandas beginner friendly?
Yes. Pandas provides simple and intuitive functions that make data analysis accessible even for beginners.

